

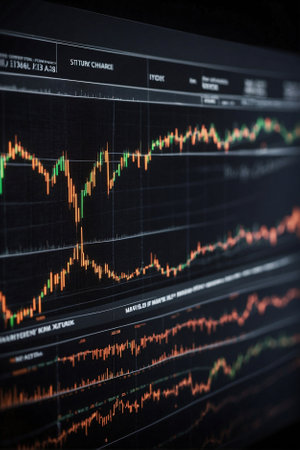
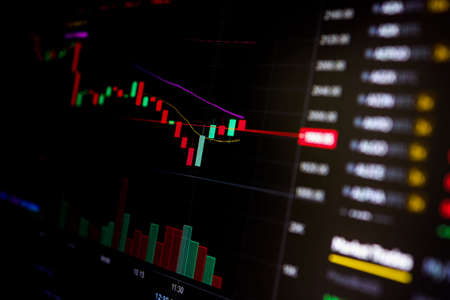
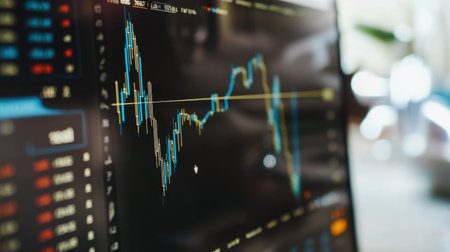
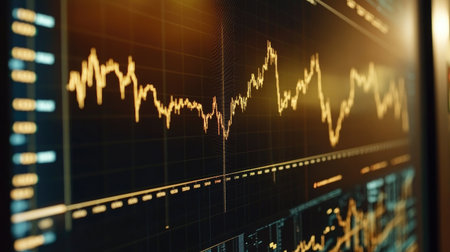
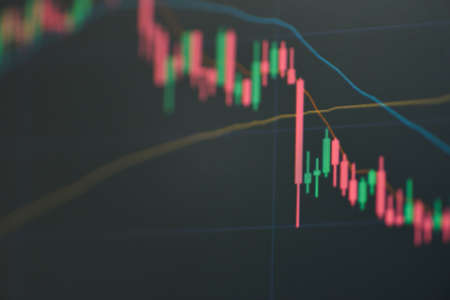
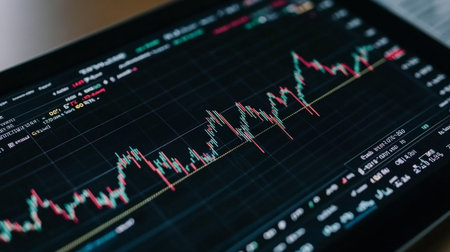
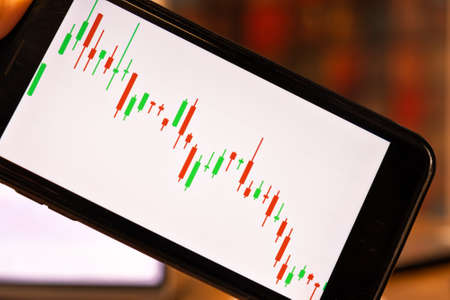
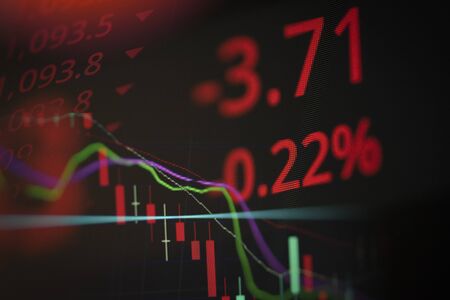
Shallow depth of field (selective focus) with details of a chart showing the stock market crash from March 2020 due to the Covid-19 pandemic on a computer screen (S&P500 index)
Коллекция по умолчанию
Коллекция по умолчанию
Создать новую

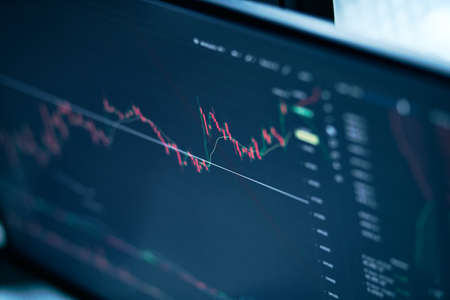
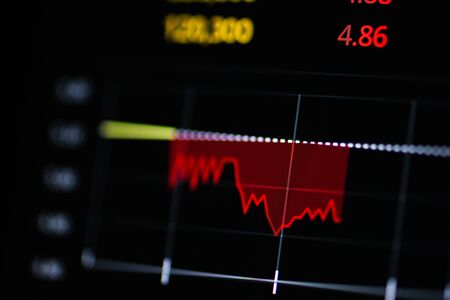
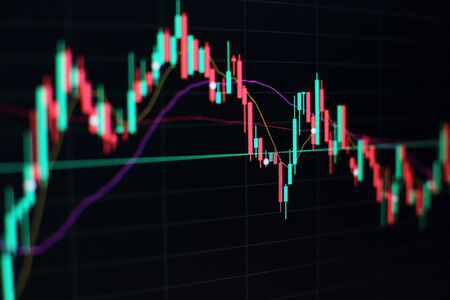
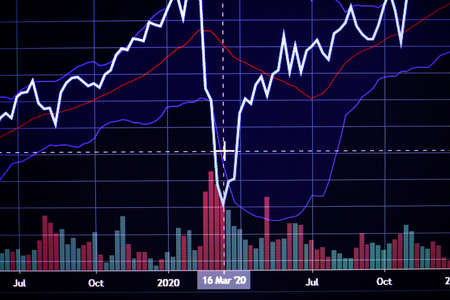
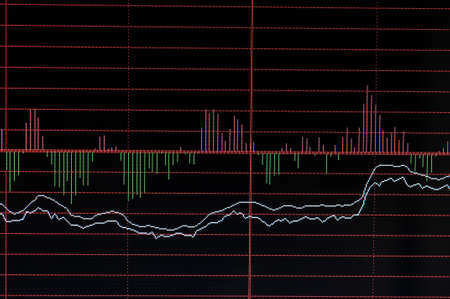
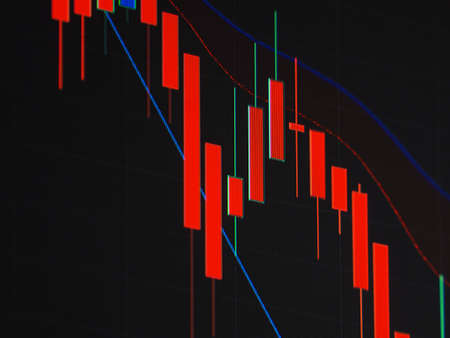
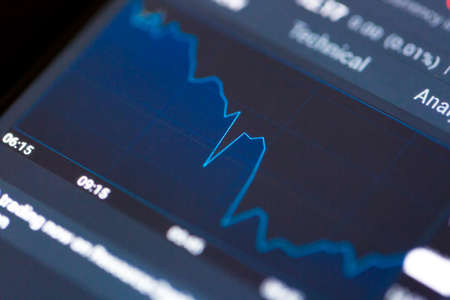
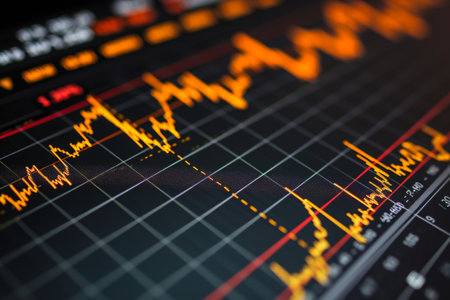
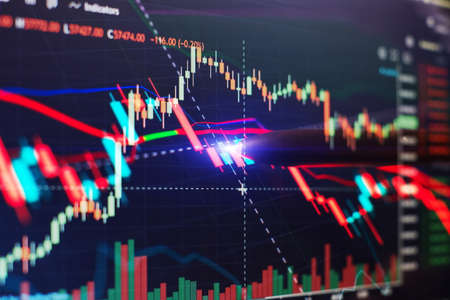
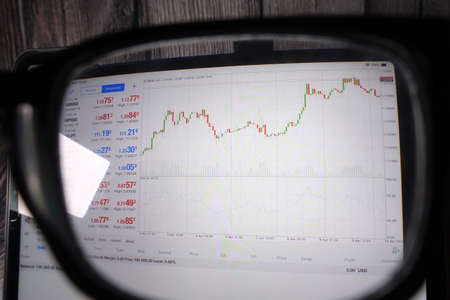
image of the financial graph on a computer monitor.
Коллекция по умолчанию
Коллекция по умолчанию
Создать новую

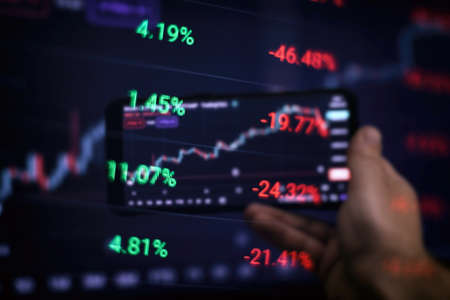
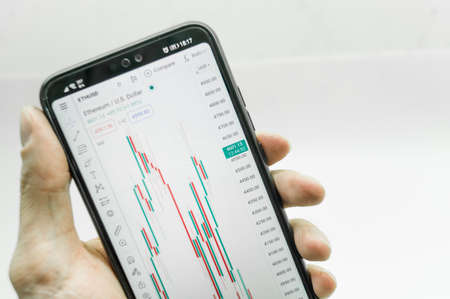
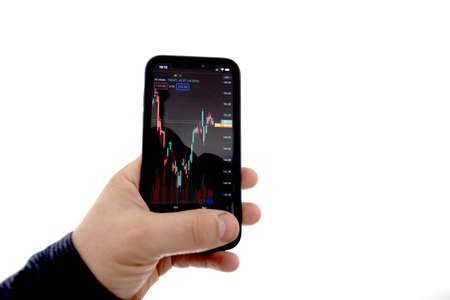
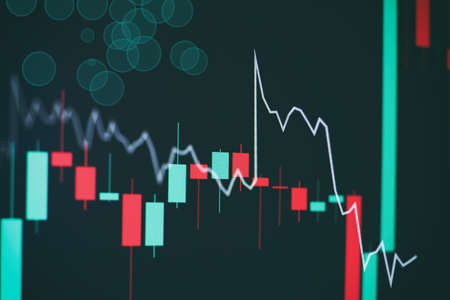
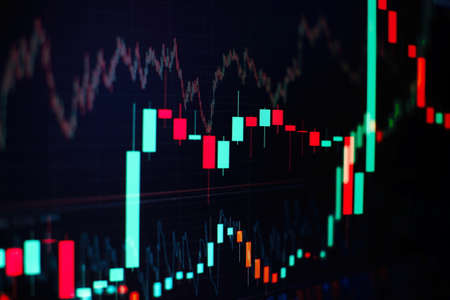
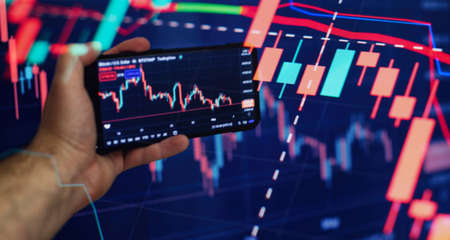
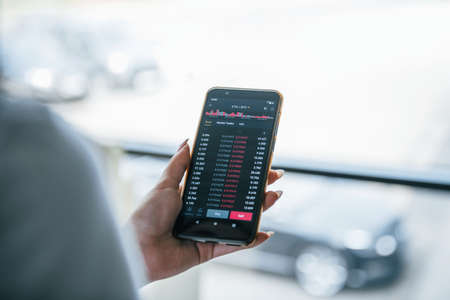
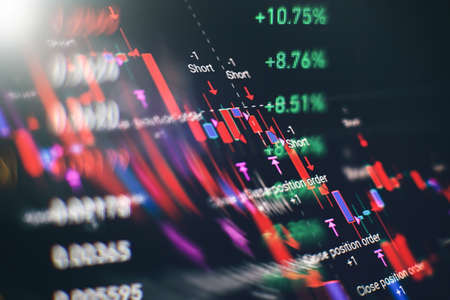
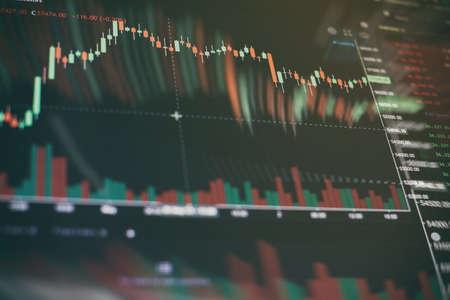
Trader investor broker holding finger using cell phone app executing financial stock trade market trading order to buy or sell
Коллекция по умолчанию
Коллекция по умолчанию
Создать новую

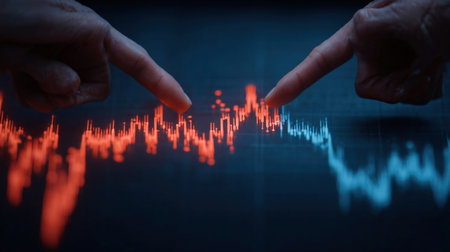
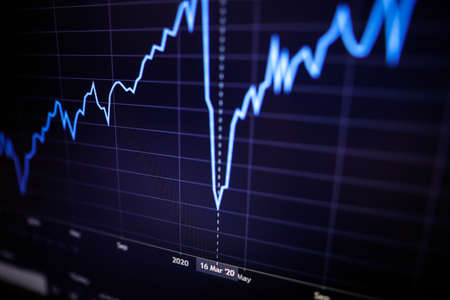
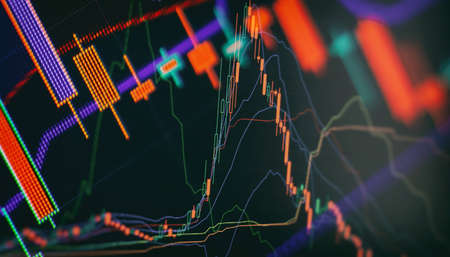
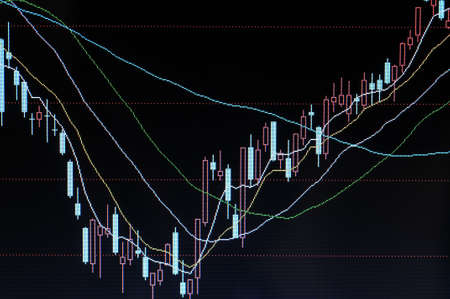
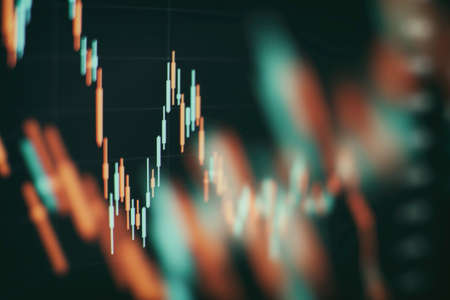
Business financial or stock market background. Business graph on stock market financial exchange
Коллекция по умолчанию
Коллекция по умолчанию
Создать новую

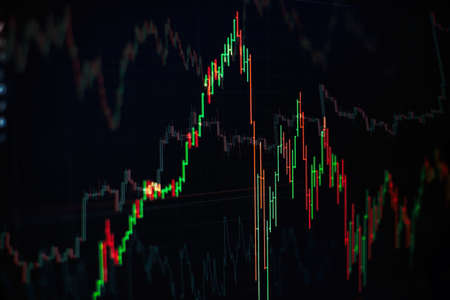
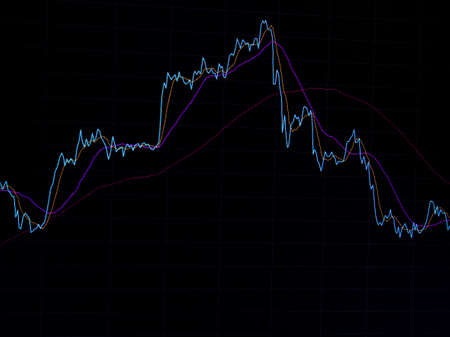
A stock market graph on a black background.
Коллекция по умолчанию
Коллекция по умолчанию
Создать новую

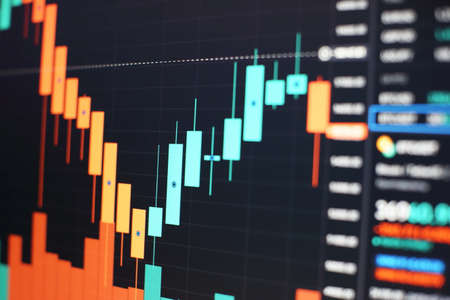
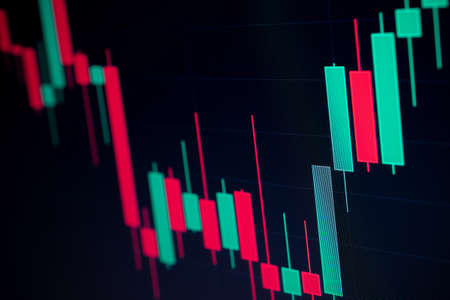
Business and Economy Theme. Trading Cryptocurrencies. Stock Market Candles Chart on Computer Display Close Up.
Коллекция по умолчанию
Коллекция по умолчанию
Создать новую

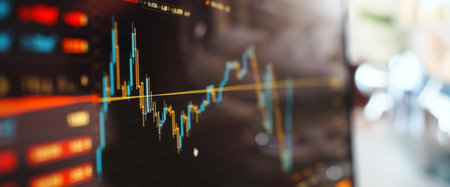
Financial stock market graph. Stock Exchange. Selective focus.
Коллекция по умолчанию
Коллекция по умолчанию
Создать новую

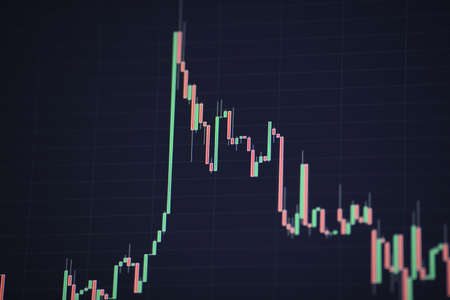
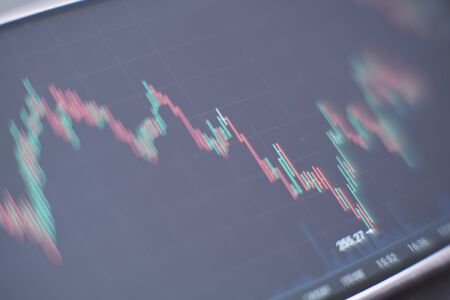
Shallow depth of field (selective focus) with details of a candlestick chart on a computer screen.
Коллекция по умолчанию
Коллекция по умолчанию
Создать новую
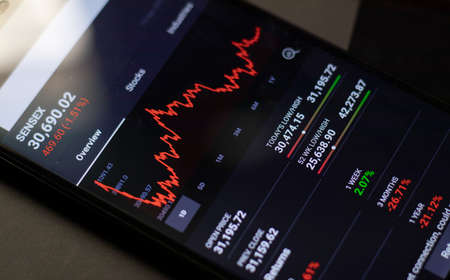
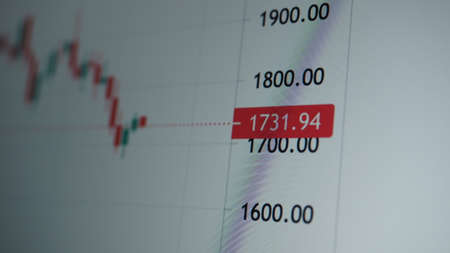
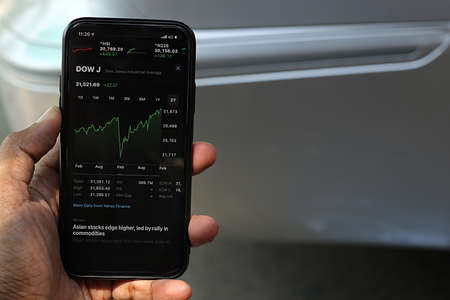
Maski, India - April 14, 2020 : Crash in sensex share market on mobile during covid-19 lockdown.
Коллекция по умолчанию
Коллекция по умолчанию
Создать новую

A detailed close-up view of a candlestick chart displaying stock data. The graphic illustrates financial trends with vibrant colors, aiding data analysis.
Коллекция по умолчанию
Коллекция по умолчанию
Создать новую
graph of financial growth on a computer monitor. cryptocurrency.
Коллекция по умолчанию
Коллекция по умолчанию
Создать новую

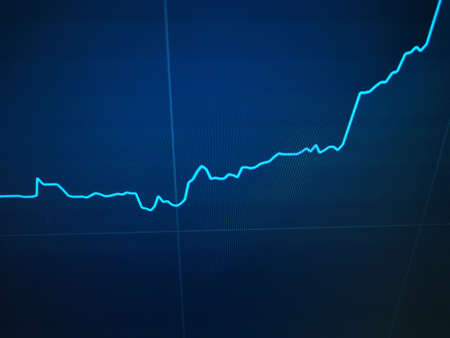
graph of financial growth on a computer monitor.
Коллекция по умолчанию
Коллекция по умолчанию
Создать новую

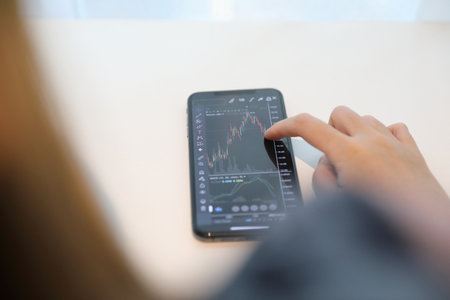
Follow stock prices, stock quotes and the rise and fall of the cryptocurrency on a mobile tablet. The hand draws on the tablet screen using a stylus. close-up small depth of field
Коллекция по умолчанию
Коллекция по умолчанию
Создать новую

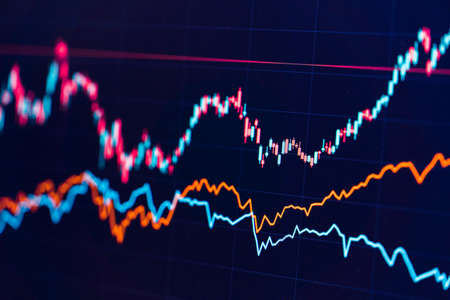
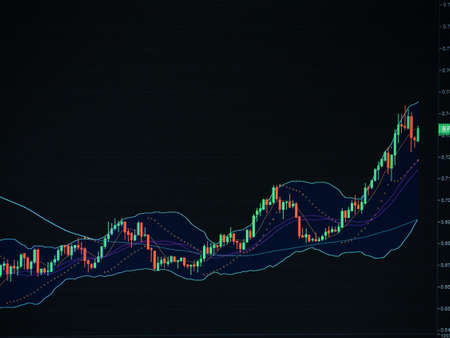
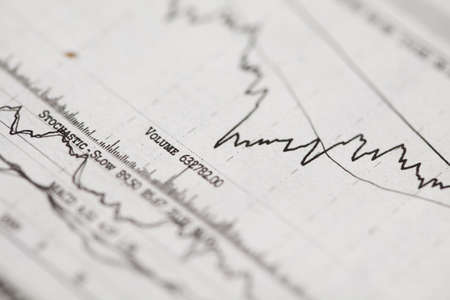
Financial instruments with various types of indicators including volume analysis for professional technical analysis
Коллекция по умолчанию
Коллекция по умолчанию
Создать новую

Stockmarket online trading chart candlestick on crypto currency platform. Stock exchange financial market price candles graph data pattern analysis concept. Computer screen closeup background
Коллекция по умолчанию
Коллекция по умолчанию
Создать новую

Financial stock market graph. Stock Exchange. Selective focus.
Коллекция по умолчанию
Коллекция по умолчанию
Создать новую

Data analyzing in Forex, Commodities, Equities, Fixed Income and Emerging Markets: the charts and summary info show about Business statistics and Analytics value - Wealth management concept.
Коллекция по умолчанию
Коллекция по умолчанию
Создать новую

Fundamental and technical analysis concept.
Коллекция по умолчанию
Коллекция по умолчанию
Создать новую
Indicators including volume analysis for professional technical analysis on the monitor of a computer. Fundamental and technical analysis concept.
Коллекция по умолчанию
Коллекция по умолчанию
Создать новую

The Stock Exchange, Streaming Trade Screen, The stock screen shows a list of stocks with reduced value.
Коллекция по умолчанию
Коллекция по умолчанию
Создать новую

Radiated emissions spectrogram with limit lines in EMC electromagnetic compatibility test report
Коллекция по умолчанию
Коллекция по умолчанию
Создать новую
Working set for analyzing financial statistics and analyzing a market data. Data analysis from charts and graphs
Коллекция по умолчанию
Коллекция по умолчанию
Создать новую

indicators including volume analysis for professional technical analysis on the monitor of a computer. Fundamental and technical analysis concept.
Коллекция по умолчанию
Коллекция по умолчанию
Создать новую
A chart of financial exchange quotes on a smartphone screen in hand. Trading on the stock exchange from a mobile phone. Close-up, selective focus
Коллекция по умолчанию
Коллекция по умолчанию
Создать новую
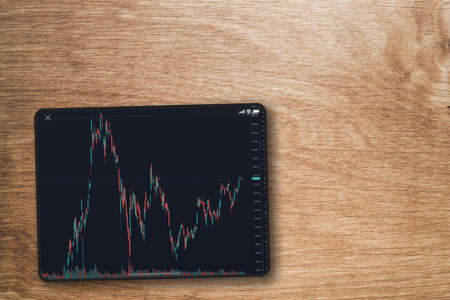
Financial stock market graph on the tablet screen on wooden background. Top view. Stock Exchange.
Коллекция по умолчанию
Коллекция по умолчанию
Создать новую
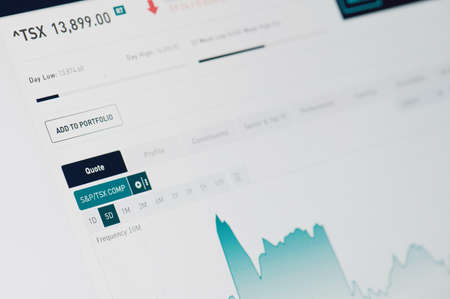
New-York , USA - April 17 , 2020: Graph in Toronto Stock Exchange close up view on computer screen
Коллекция по умолчанию
Коллекция по умолчанию
Создать новую

Stock market candlestick chart, asset prices movement, currency exchange price action simple concept. Computer screen, display, candle chart, graph detail, extreme closeup, nobody, no people
Коллекция по умолчанию
Коллекция по умолчанию
Создать новую
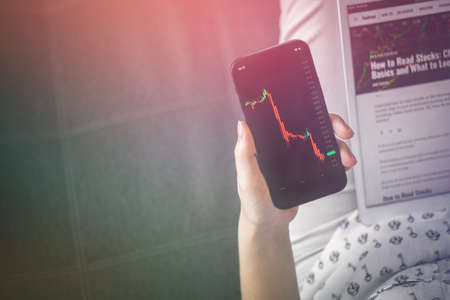
Checking stock market price chart on mobile phone while reading the news, copy space photo
Коллекция по умолчанию
Коллекция по умолчанию
Создать новую
Stock Market Chart on Dark Background: Financial Analytics. Digital Art: Modern Technologies
Коллекция по умолчанию
Коллекция по умолчанию
Создать новую
View of Stock Market Crash from Covid-19 Pandemic with shallow depth of field.
Коллекция по умолчанию
Коллекция по умолчанию
Создать новую

Abstract candlestick chart on white digital screen. Stock market or crypto data chart, graph with rectangular grid on light background.
Коллекция по умолчанию
Коллекция по умолчанию
Создать новую
Stock market investment app in hand. Telephone with a stock chart. Screen close-up
Коллекция по умолчанию
Коллекция по умолчанию
Создать новую
Close up of hand pointing at glowing business chart on dark blue background. Stock, market and trade concept.
Коллекция по умолчанию
Коллекция по умолчанию
Создать новую
The dynamics of changes in currencies. Price growth chart and economic recovery
Коллекция по умолчанию
Коллекция по умолчанию
Создать новую
Analysis business accounting on info sheets. Businessman hand working on analyzing investment charts for Gold market, Forex market and Trading market.
Коллекция по умолчанию
Коллекция по умолчанию
Создать новую
World GOLD Spot Stock market graph indicator on monitor. Gold graph on digital screen monitor for invester analysis. trading gold spot on stock market. Gold Investing Finance and Economic concept.
Коллекция по умолчанию
Коллекция по умолчанию
Создать новую

Candle stick graph chart with indicator showing bullish point or bearish point, up trend or down trend of price of stock market or stock exchange trading, investment and financial concept.
Коллекция по умолчанию
Коллекция по умолчанию
Создать новую
Financial stock market graph. Stock Exchange. Selective focus.
Коллекция по умолчанию
Коллекция по умолчанию
Создать новую
Tablet Index, Exchange Trading Forex Finance Graphic Concept
Коллекция по умолчанию
Коллекция по умолчанию
Создать новую

Analysis business accounting on info sheets. Businessman hand working on analyzing investment charts for Gold market, Forex market and Trading market.
Коллекция по умолчанию
Коллекция по умолчанию
Создать новую
Stock exchange, cryptocurrency price chart on a screen. Candlestick chart, btc. Online currency exchange market. Trading, bidding. Tracking the cryptocurrency rate. 4K. Close up.
Коллекция по умолчанию
Коллекция по умолчанию
Создать новую

schedules and charts of financial instruments, quotations of currencies, changes in real time. Japanese candlesticks used in technical analysis of market trends.
Коллекция по умолчанию
Коллекция по умолчанию
Создать новую

Stock market data.Online trading,investing platform on the computer screen.Blurred background.
Коллекция по умолчанию
Коллекция по умолчанию
Создать новую

Vibrant candlestick patterns and descending trend lines illustrate a market downturn, highlighting analysis tools amid a somber financial atmosphere.
Коллекция по умолчанию
Коллекция по умолчанию
Создать новую
Bar graphs, Diagrams, financial figures. Forex chart. Abstract glowing forex chart interface wallpaper. Investment, trade, stock, finance and analysis concept.
Коллекция по умолчанию
Коллекция по умолчанию
Создать новую
Sustainable portfolio management, long term wealth management with risk diversification concept.
Коллекция по умолчанию
Коллекция по умолчанию
Создать новую
A financial chart illustrates a notable surge in stock market profits, fueled by rising interest rates and consistent growth in money investments during recent months.
Коллекция по умолчанию
Коллекция по умолчанию
Создать новую

Abstract glowing forex chart interface wallpaper. Investment, trade, stock, finance and analysis concept.
Коллекция по умолчанию
Коллекция по умолчанию
Создать новую
Shallow depth of field (selective focus) with details of a chart showing the stock market crash from March 2020 due to the Covid-19 pandemic on a computer screen (S&P500 index)
Коллекция по умолчанию
Коллекция по умолчанию
Создать новую
The Forex graph chart on the digital screen. Working set for analyzing financial statistics and analyzing a market data.
Коллекция по умолчанию
Коллекция по умолчанию
Создать новую

Financial stock market graph. Stock Exchange. Selective focus.
Коллекция по умолчанию
Коллекция по умолчанию
Создать новую

Indicators including volume analysis for professional technical analysis on the monitor of a computer. Fundamental and technical analysis concept.
Коллекция по умолчанию
Коллекция по умолчанию
Создать новую
Shallow depth of field (selective focus) with details of a chart showing the stock market crash from March 2020 due to the Covid-19 pandemic on a computer screen (S&P500 index)
Коллекция по умолчанию
Коллекция по умолчанию
Создать новую
Business or Financial Reference: Displaying stock market data, stock exchange or chart on a monitor, stock market chart, stock exchange or chart. stock market investment trading chart.
Коллекция по умолчанию
Коллекция по умолчанию
Создать новую
A live stock market billboard with gains and losses curves
Коллекция по умолчанию
Коллекция по умолчанию
Создать новую
The business plan at the meeting and analyze financial numbers to view the performance of the company.
Коллекция по умолчанию
Коллекция по умолчанию
Создать новую
A vibrant image of a large monitor displaying a detailed gold price chart with various technical indicators and a prominent upward trend in gold prices.
Коллекция по умолчанию
Коллекция по умолчанию
Создать новую
Stock market exchange candlestick chart graph closeup, macro, Day trading concept. candle sticks on screen up close, technical analysis business abstract blur bg, forex wide background texture
Коллекция по умолчанию
Коллекция по умолчанию
Создать новую

Candle stick graph chart of stock market investment trading. The Forex chart on the digital screen. Bar graphs, Diagrams, financial figures. Forex chart.
Коллекция по умолчанию
Коллекция по умолчанию
Создать новую
Sustainable portfolio management, long term wealth management with risk diversification concept.
Коллекция по умолчанию
Коллекция по умолчанию
Создать новую

Financial stock market graph. Stock Exchange. Selective focus.
Коллекция по умолчанию
Коллекция по умолчанию
Создать новую

stock indexes in virtual space. Economic growth, recession. Electronic virtual platform showing trends and stock market fluctuations
Коллекция по умолчанию
Коллекция по умолчанию
Создать новую
Stock Market Trading Chart Investment Analysis Business Index Chart Finance Board Chart
Коллекция по умолчанию
Коллекция по умолчанию
Создать новую
Technical price graph and indicator, red and green candlestick chart on blue theme screen, market volatility, up and down trend. Stock trading, cryptocurrencies background.
Коллекция по умолчанию
Коллекция по умолчанию
Создать новую
Stock market exchange graph chart, stock trade graph candlestick financial investment trade, Forex graph business or Trading crypto currency technical price with indicator on chart screen trend
Коллекция по умолчанию
Коллекция по умолчанию
Создать новую
Stock Market Loss Trading Chart Investment Analysis Business Index Chart Finance Board Chart
Коллекция по умолчанию
Коллекция по умолчанию
Создать новую
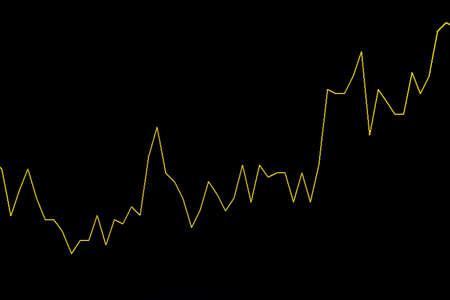
Continuous Uptrend Yellow Stock Chart or Forex Chart on Black Background
Коллекция по умолчанию
Коллекция по умолчанию
Создать новую
Technical price graph and indicator, red and green candlestick chart on blue theme screen, market volatility, up and down trend. Stock trading, cryptocurrencies background.
Коллекция по умолчанию
Коллекция по умолчанию
Создать новую
A close-up of a digital stock market chart displayed on a tablet, showing fluctuating lines and numbers, capturing the essence of trading activities.
Коллекция по умолчанию
Коллекция по умолчанию
Создать новую
Stock exchange market chart background. Candle stick graph chart with indicator.
Коллекция по умолчанию
Коллекция по умолчанию
Создать новую

forex trading graph and candlestick chart suitable for financial investment concept. Economy trends background for business idea and all art work design. Abstract finance background.
Коллекция по умолчанию
Коллекция по умолчанию
Создать новую
Abstract image of financial data and stock market analysis with colorful graphs and charts, representing economic trends and market fluctuations.
Коллекция по умолчанию
Коллекция по умолчанию
Создать новую
Female hand with smartphone trading stock online. Business concept
Коллекция по умолчанию
Коллекция по умолчанию
Создать новую
Statistics & Business
Коллекция по умолчанию
Коллекция по умолчанию
Создать новую

Business chart with line graph, bar chart and numbers on dark background, 3d rendering. Computer digital drawing.
Коллекция по умолчанию
Коллекция по умолчанию
Создать новую
Business and trading finance contept. Stock exchange market chart view on smart phone screen.
Коллекция по умолчанию
Коллекция по умолчанию
Создать новую
Working set for analyzing financial statistics and analyzing a market data. Data analysis from charts and graphs
Коллекция по умолчанию
Коллекция по умолчанию
Создать новую

Analyzing financial statistics and analyzing a market data. Data analysis from charts and graphs
Коллекция по умолчанию
Коллекция по умолчанию
Создать новую
February 23, 2021 Stock markets around the world continue sideways and declines. Investors continue to monitor. So as not to miss any investment opportunities
Коллекция по умолчанию
Коллекция по умолчанию
Создать новую
Close up view of phone holding by woman with business and exchange information.
Коллекция по умолчанию
Коллекция по умолчанию
Создать новую
Female hand with smartphone trading stock online in coffee shop , Business concept
Коллекция по умолчанию
Коллекция по умолчанию
Создать новую
Investment planning. Graphics growth forex finance market on tablet screen. Financial chart, stock analysis data. Business strategy, financial and banking digital marketing
Коллекция по умолчанию
Коллекция по умолчанию
Создать новую
A live stock market billboard with gains and losses curves
Коллекция по умолчанию
Коллекция по умолчанию
Создать новую

forex trading graph and candlestick chart suitable for financial investment concept. Economy trends background for business idea and all art work design. Abstract finance background.
Коллекция по умолчанию
Коллекция по умолчанию
Создать новую
Background of Stock market graph chart on LED display. Trading concept
Коллекция по умолчанию
Коллекция по умолчанию
Создать новую
Stockmarket online trading chart candlestick on crypto currency platform. Stock exchange financial market price candles graph data pattern analysis concept. Computer screen closeup background
Коллекция по умолчанию
Коллекция по умолчанию
Создать новую
View of Stock Market Crash from Covid-19 Pandemic with shallow depth of field.
Коллекция по умолчанию
Коллекция по умолчанию
Создать новую
A stock investor shows another investor the behavior of a stock on the stock market on the monitor. Concept economy, stock market.
Коллекция по умолчанию
Коллекция по умолчанию
Создать новую
securities price chart on the monitor screen
Коллекция по умолчанию
Коллекция по умолчанию
Создать новую
Analysis business accounting on info sheets. Businessman hand working on analyzing investment charts for Gold
Коллекция по умолчанию
Коллекция по умолчанию
Создать новую
A zoomed-in view of a real-time stock market chart being displayed on a computer monitor, A chart displaying the correlations between different financial markets, AI Generated
Коллекция по умолчанию
Коллекция по умолчанию
Создать новую
Stock market business graph chart on digital screen.Forex market, Gold market and Crude oil market.
Коллекция по умолчанию
Коллекция по умолчанию
Создать новую
Close up n hand holding smart phone with candle graph for trade stock market investment crypto currency
Коллекция по умолчанию
Коллекция по умолчанию
Создать новую
Financial chart with pen, stock analysis data for business background on digital screen. Graphs of the growth of the financial market forex. trading candlestick chart
Коллекция по умолчанию
Коллекция по умолчанию
Создать новую

Financial stock market graph. Stock Exchange. Selective focus.
Коллекция по умолчанию
Коллекция по умолчанию
Создать новую

Financial data on a monitor,Stock market data on LED display concept
Коллекция по умолчанию
Коллекция по умолчанию
Создать новую
Working set for analyzing financial statistics and analyzing a market data. Data analyzing from charts and graph to find out the result.
Коллекция по умолчанию
Коллекция по умолчанию
Создать новую
Abstract glowing blue forex chart background with bokeh circles.
Коллекция по умолчанию
Коллекция по умолчанию
Создать новую
Stock market exchange loss trading graph analysis investment indicator business graph charts of financial board display candlestick double exposure crisis stock crash red price chart fall money
Коллекция по умолчанию
Коллекция по умолчанию
Создать новую
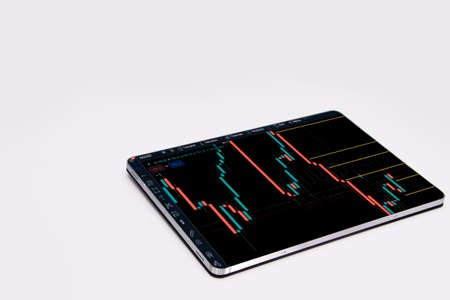
Trading forex with METATRADER 4 on Apple iPad Pro 11 inch. iPad Pro is the most user friendly which good for people on the go.
Коллекция по умолчанию
Коллекция по умолчанию
Создать новую
Legion-Media
Создайте свои проекты на основе качественных стоковых фотографий и видео.


Copyright © Legion-Media.